As a practicing data scientist, I have regular need to present and distribute the results of analyses, or to provide descriptive statistics on data sets. Ideally these results can be presented in the form of interactive graphics, standalone applications, or as continually updating dashboards. There are a range of excellent dashboard and visualisation building softwares available such as Qlikview, Tableau, and Pentagon but the license fees for such programs can run into the thousands of euro. This expense makes the delivery of such solutions prohibitively expensive for a great deal of small businesses that would otherwise be interested in analytics and data visualisation solutions.
The closest free solution is the brilliant Shiny package developed by RStudio. Shiny is an R package that “makes it super simple for R users to turn analyses into interactive web applications that anyone can use.” Shiny is excellent for rapid protoyping of visualisations. However, the software requires a standalone Linux server for hosting, and is still in beta release. Also, as of yet, I’ve struggled to find a solution to effectively passwording a Shiny application, which isn’t ideal for sensitive data analyses.
As such, I’ve taken to developing custom-built HTML and CSS-based interactive dashboards and visualisations. Unfortunately, there is no handy plug and play solution for this, and I’ve had to improve my knowledge in the areas of Javascript, jQuery, CSS, HTML, and server technology.
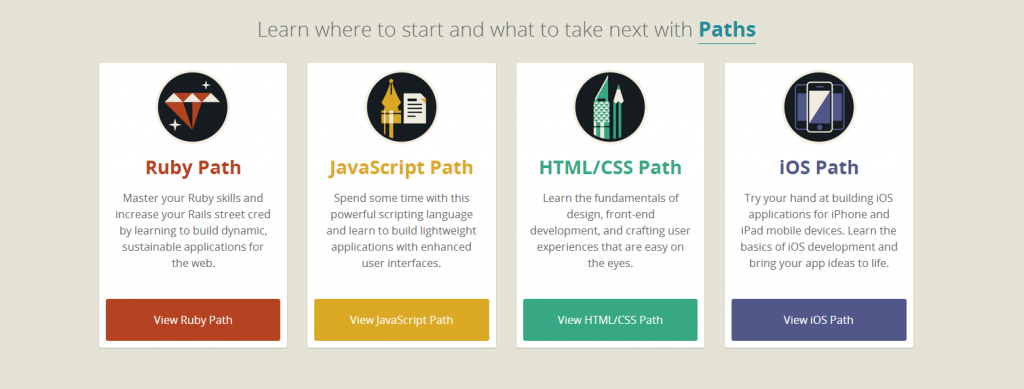
Key to this transition was the online learning site Codeschool. With excellent instructors, and somewhat corny introduction videos, CodeSchool offer 4 different “learning paths” (or courses) of classes:
- Javascript
- HTML/CSS
- iOS
- Ruby
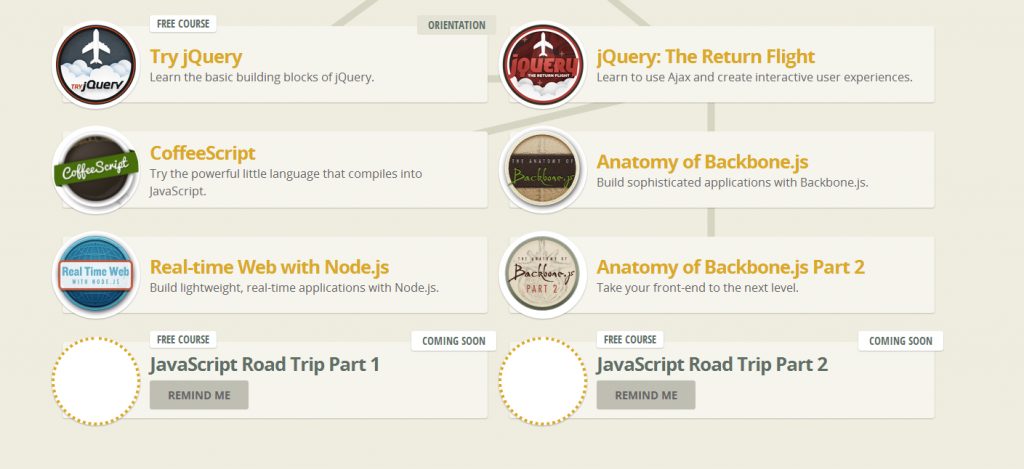
I’ve been focussed on the JavaScript path for now. I’ve gone from zero-knowledge to a relatively competent JavaScript developer in a matter of months (taking into account fairly extensive experience in other languages on starting). The introductions to jQuery and jQuery advances courses have given me all of the skills required to implement interactive web pages as required recently. I’ll upload some examples in coming posts.

The CodeSchool tagline, “Learn By Doing” is brought alive by their course structure, each of which are made up of a short video lecture followed by 5-10 coding exercises that are checked for correctness in the browser window. Points are awarded per stage, and hints are available if you get stuck. I found that taking notes during the video lecture helped increase my knowledge retention, and the exercises were excellent for hammering those memories in. I find it takes 10-20 minutes commitment per “stage”, and each module is made up of 5-8 stages. 6-8 modules make up a path. You’re awarded badges for every stage and module completed to fulfill the external-validation-seeking part of yourself. Gold stars all around!
This is the first time I’ve spent real money on an online learning environment (first month is priced at $9 if you go here, and $25 per month afterwards), and well worth it so far! You can try the first course of each learning path for free on CodeSchool’s website, and I’d recommend you check it out. I’m currently working through the details of Backbone JS, a model-view-controller library for handling data sensibly in your JavaScript applications.
[…] to handle incoming and trigger outgoing events. I would really recommend the JavaScript path on CodeSchool if you are not familiar with these […]